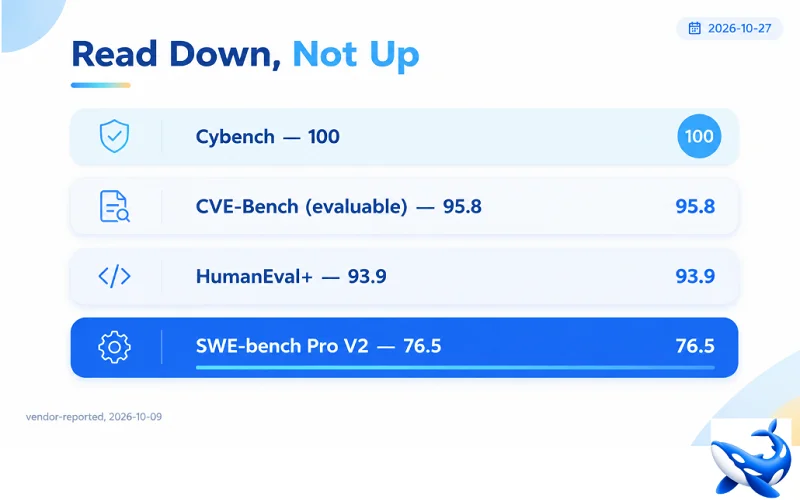
A score of one hundred on any benchmark invites a specific reaction: someone is going to say the benchmark is broken. Through OrcaRouter you reach the orca cyber zero 1.5 card, where the perfect row is Cybench under unrestricted agent execution — and the more useful conversation is about the row underneath it, 95.8 on the evaluable subset of CVE-Bench [VENDOR]. That number, and the word “evaluable”, tell you more about the model than the hundred does.
Here is the whole table, in the order the page publishes it.
| Benchmark | Score | Source |
| Cybench, unrestricted agent execution | 100.0% | OrcaCyber, 2026-10-09 |
| CVE-Bench, evaluable subset | 95.8% | OrcaCyber, 2026-10-09 |
| HumanEval+ | 93.9% | OrcaCyber, 2026-10-09 |
| SWE-bench Pro V2 | 76.5% | OrcaCyber, 2026-10-09 |
All four are the lab’s own claims. None has been independently reproduced. That caveat applies to every row equally, and it is the reason the internal relationships between the rows matter more than any single number.
Why 100 on Cybench is a low-information result
Cybench in unrestricted agent execution lets the model act. The harness does not police the model’s choices; it measures whether the model completes the challenge. A perfect score therefore says the model does not refuse, does not stall, and does not talk itself out of the task.
That is a real property, and for a model tuned for security work it is the minimum bar rather than an achievement. A model that scored 70 on this benchmark would be telling you something — that it stops partway through. A model that scores 100 is telling you it does not. There is no headroom left for the number to describe quality.
The evaluable-subset framing on CVE-Bench is the opposite: it is a number that admits what it cannot measure. CVE-Bench asks whether a model can reproduce known vulnerabilities; some of its cases cannot be evaluated automatically, so the score is computed over the subset that can. Publishing the qualifier in the row name is a small act of honesty that most cards skip.
The two rows that describe delivery
HumanEval+ at 93.9 is function-level code generation with an expanded test suite — the strict variant of the original HumanEval. It is a saturated benchmark for strong models, and 93.9 is a normal score for a capable one. Read it as a floor: the model can write functions that pass tests.
SWE-bench Pro V2 at 76.5 is the interesting row. It measures resolving real software issues in real repositories, and it is the closest thing on the card to “can this model do the engineering work”. Seventy-six and a half is a working score, not a state-of-the-art one.
Put the security reasoning row and the engineering row side by side: 95.8 for finding and explaining, 76.5 for delivering. That gap of about nineteen points is the model’s shape. It is better at analysis than at implementation, which matches how security work is usually split between people who hunt and people who fix.
What the row ordering implies for a workflow
If you are building a pipeline, the ordering suggests a division of labour:
- Use the model for triage and reproduction. The CVE-Bench number is the evidence that it can reason about known vulnerability classes.
- Use it for report generation. A 128,000-token output ceiling and structured JSON output are built for producing findings that downstream systems can parse.
- Do not assume the patch it writes is production-ready. SWE-bench Pro V2 at 76.5 means roughly one issue in four does not get resolved cleanly, and that is a benchmark; your codebase is harder.
That last point is the practical value of reading a table honestly. The card publishes a perfect score and a seventy-six on adjacent lines, and the seventy-six is the one that changes how you wire it up.
A note on what a four-row table leaves out
Four rows is a short table, and the omissions are as informative as the inclusions.
There is no long-context benchmark. The card’s headline spec is a million-token window, and none of the four rows exercises it. A model can score 95.8 on CVE-Bench and still lose the thread at 600,000 tokens; nothing here would show that. If long-context reasoning is the reason you are buying, test it yourself with a document you know the answer to.
There is no latency or throughput row. Both live elsewhere on the page, and both matter more than any score for whether the card fits a workflow: 1,749 ms median first token and 114.5 tokens per second over the measured week [OURS].
There is no tool-use benchmark. The card supports function calling, and the Cybench row is the closest proxy, but it is a proxy.
There is no comparison row. The table lists this model’s scores without the base checkpoint’s beside them, so a reader cannot see how much of the capability came from the tuning and how much was already there.
None of that is a criticism of this particular page — most cards publish four to eight rows and stop. It is a reminder that a benchmark table answers the questions the vendor chose to ask.
Serving numbers, for completeness
A benchmark table says nothing about whether the model is usable at volume. Over the seven days ending 2026-10-26 this card moved 30,631,363,967 tokens on our gateway, with a p50 first token of 1,749 ms, output throughput of 114.5 tokens per second, and an error rate of 0.075% [OURS].
The error rate is the standout. Under a tenth of a percent across thirty billion tokens is the kind of figure you want on a workload that runs for hours and cannot be restarted cheaply — a full repository audit, a log-forensics pass, an incident timeline.
The takeaway
A hundred on Cybench is a statement that the model does not refuse, and for a model built to be used on authorized security work that is table stakes. The row that should set your expectations is 76.5 on SWE-bench Pro V2, next to 95.8 on CVE-Bench: strong at finding and explaining, competent but not complete at fixing.
Buying decisions do not come from the top of a benchmark table. They come from the bottom row and from the throughput figure, and both are published here.
Sourcing note: all four benchmark rows are OrcaCyber’s own claims, evaluated 2026-10-09 and published on the model page, none independently reproduced [VENDOR]. Latency, throughput, traffic and error rate are OrcaRouter production telemetry for the seven days ending 2026-10-26 [OURS]. The benchmark definitions described are the standard published definitions for each harness.